
Article Summary
Key Takeaways
Full Article
For this month's Toolkit we've been exploring one of our favourite—and generally overlooked challenges. Data Visualization.
What is Data Visualization (DataVis)?
If you do a simple search you will see data visualization defined in the dictionary as “representing information in the form of a chart, diagram, picture” and Wikipedia as “a modern equivalent of visual communication. The creation and study of the visual representation of data.” These definitions are pretty shallow but generally most people will agree that they are both fairly accurate in theory.
What is the future of datavis?
We continue to talk about the future of technology like blockchain, IoT, machine learning, VR, and AR but what about all the ancillary technology and expertise such as data visualization. As we see more people specializing in machine learning I see more and more specializing in UI and data vis to help support communication of the increasing amount of data.

Data Visualization has been around since we were drawing stories of successful hunts in the cave to current day dashboards, conceptual models, and augmented reality displays.
Before we look at the future of data vis a quick history from “Milestones in the History of Data Visualization: A Case Study in Statistical Historiography” by Michael Friendly, professor of psychology, and chair of the graduate program of Quantitative Methods at York University.
- Pre 17th Century, maps were typically the only form
- 1644 Michaael Florent Van Langren a flemish astronomer provided the first visual representation of data
- 18th century saw the beginning of thematic mapping
- 18th century also gave us William Playfair who is widely considered to have invented popular graphs like the line bar and pie chart
- 19th century, Golden Age of statistical graphics driven by the industrial revolution
- 20th century, modern dark ages for statistical data images were considered overly inaccurate
- Later half of 20th century rebirth of data vis brought on my computer processing and larger volume of data
- 60’s and 70’s gave us John W Tukey in the Us and Jacques Bertin in France who developed the science of information visualization in stats and cartography
- Early 80’s saw emergence of Edward Tufte who’s work The Visual Display of Quantitative Information is still used today
- Last two decades has seen an explosion in volume and focus areas
As a result of the massive explosion of technology, data, our increasing understanding of the effectiveness of data visualization, and cheap/reliable storage we are now and more increasingly going to see data visualization as an expertise more prevalent in our day to day lives. The level of flexibility we now have to create visualizations that help communicate complex ideas in some contexts is a revenue and business driver for organizations and ideas.

What is it and where is it going?
To look at the future of data visualization you need to look at the future and use of data across industries and technology.
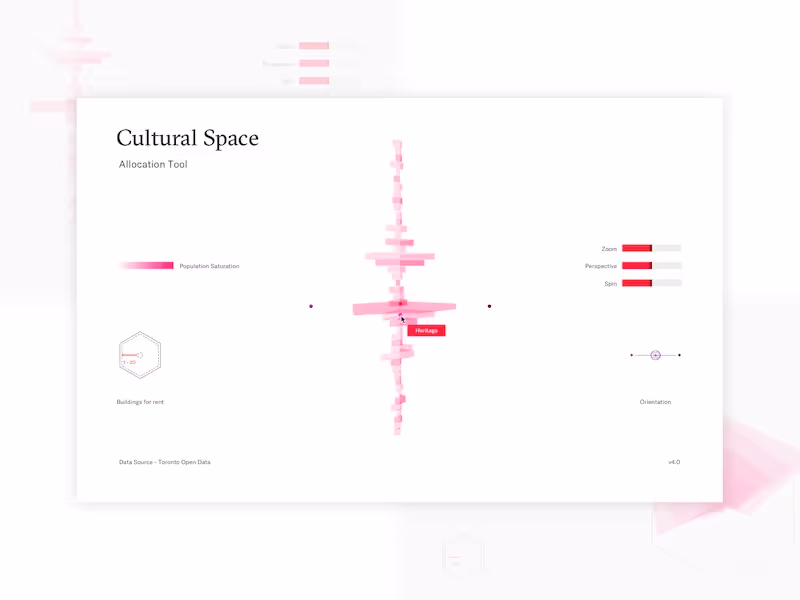
IoT has barely scratched the surface. We ourselves had an interesting experiment with technology and data tracking. We tracked approximately 200 people in a physical space, in real-time. That exercise alone deployed across 5 cities for a total of about 20 hours captured over 1M data points (see more here). We then processed all of that data into a visualization that as a participant you could summarize in seconds. Now imagine an interconnected everything world.
Which creates another need. Applications, models and stream-able data. In the future it will be a luxury to have a database in between, generating data and outputting models because of the immediacy and availability of large and fast datasets. Certain devices will need to be outputting data visuals at speeds fast enough to improve safety, drive efficiency and understand demand and behaviour.
These devices will likely also be some of the same devices that will be producing data visualizations in augmented reality. Layering data over our physical world using models and designs that will help us instantly make decisions while in high risk scenarios like driving.
With data visualization and augmented reality our physical environment will be transformed into data before our very eyes.
Now, consider the policy changes of late around privacy and personal data. What might the future hold for the use of data, and what if we the people were given unfettered control to protect or broadcast our own data?